


7 quality control tools
Corporations, companies, and factories have a variety of problems when your employees
- Do not well manage their quality of work and products in the areas under their charge.
- Do not know how to analyze and visualize data in the enterprise.
- Do not realize existing problems that seriously affect the production process.
- Identify and define the problems but do not know how many causes and which is the root and must be solved first.
- Fail to offer timely preventive and protective measures when problems arise
The course “7 quality control tools” will help businesses find existing problems amongst your staff and solve them with effective methods.
COURSE OVERVIEW
Name of the course: 7 quality control tools
Object: Employees, workers, and interns
Training time: 2 – 3 days (designed as customer’s requirements)
Language: Vietnamese
Lecturers: Vietnamese
Forms of training: Inhouse or Public workshop
Training methods: Lecture presentation, discussion, and practice are organized in the classroom
PURPOSE OF COURSE
- Deeply understand the purposes and meaning of 7 quality control tools in data analysis and visualization
- Point out the problems after collecting and analyzing data
- Identify and define problems needing to focus on analysis to achieve the goals
- Calculate Cp and Cpk and assess the stability of the production stages
- Analyze and determine the root causes of the problems
TRAINING CONTENT IN THE COURSE
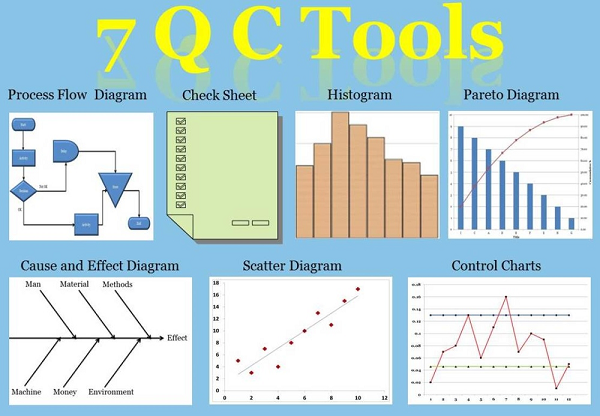
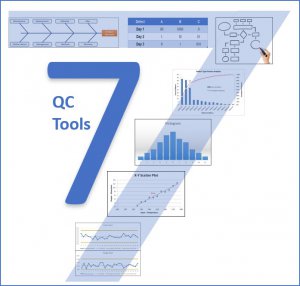
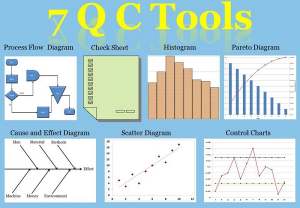
- Overview of 7 Tools For Quality Control
- What are 7 Tools for Quality Control?
- When do learners use 7 Tools for Quality Control?
- Why do learners use 7 Tools for Quality Control?
- The methods of using 7 Tools for Quality Control
- Practice: Learners share the status quo of applying 7 Tools for Quality Control at their company
- Check sheets and its usage
- What is a check sheet? What are its purposes? How many kinds of check sheets?
- Steps to make the check sheets
- Important points to make the check sheets
- Practice: Make the check sheets, collect data, and draw conclusions
- Charts and its usage
- What is a chart? And what are its purposes?
- Types of charts
- Steps to create each type of charts
- Important points to create and use charts
- Methods to determine the status quo from data on charts
- Practice: Create charts and draw conclusions related to the status quo
- Pareto Chart and its usage
- What is a Pareto chart? And what are its purposes?
- Steps to create a Pareto chart
- Important points to create a Pareto chart
- Use Pareto charts logically in problem-solving
- Practice: Create Pareto charts and draw conclusions related to the status quo
- Histogram and Cp, Cpk
- What is a histogram? And what are its purposes?
- Steps to make a histogram
- Important points to make and use a histogram
- Calculating methods of Cp and Cpk
- The assessing methods of the reliability of phases by Cp and Cpk
- Practice: Make histograms, assess Cp and Cpk, draw conclusions in the reliability of phases, and data practices
- Control chart and its usage
- What is a control chart? And what are its purposes?
- Steps to create a Control Chart
- Calculate LCL, CL, and UCL of X and R charts
- Important points to create and use a control chart
- Read a control chart and assess it for daily management
- Practice: Create X-R charts, assess the status quo of production stages, and data practices
- Scatter diagram and its usage
- What is a scatter diagram and purposes of controlling the status quo?
- Control charts for controlling
- Steps to make a scatter diagram
- Important points to make and use a scatter diagram
- How to read a scatter diagram
- How to draw regression lines
- Practice: Make scatter diagrams, draw regression lines, and conclude on the relationships between the causes and effects, and data practices
- Cause & Effect Diagram and its usage
- What is a cause & effect diagram? And what are its purposes?
- What are the root causes?
- Steps to draw a cause & effect diagram
- How to use the 5-Whys diagram
- Important points to use the cause & effect diagram and 5-Whys diagram
- Methods to verify the causes
- Practice: Create cause & effect diagrams, 5-Whys analysis, and conclude on the root causes, and outline the methods to verify causes
- Course review, action plan, and certification


FEEDBACK
N/A
N/A
N/A
TẠI SAO CHỌN JOSHIN

Founder giàu kinh nghiệm về thực trạng kinh doanh của các đơn vị trong nước sẽ luôn đưa ra hướng giải quyết phù hợp nhất cho doanh nghiệp của bạn.

Đội ngũ giảng viên 100% là người Việt, nhiệt huyết với trên 15 năm giảng dạy và làm việc trong các tập đoàn lớn của Nhật Bản.

Các khóa học thực tế hấp dẫn, hướng đến sự trao đổi, thảo luận, phát triển toàn diện các kĩ năng cho học viên.

Lộ trình đào tạo chất lượng, giải quyết tốt vấn đề đang vướng mắc của doanh nghiệp.
ĐĂNG KÝ THAM GIA KHÓA HỌC
Hotline: 088.828.9968
Email: info@joshin.vn
Facebook: facebook.com/joshintraining.vn