New 7 Quality Control tools
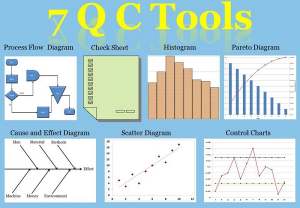
In fact, the application of 7 quality management tools can solve most of the common quality management problems encountered in the business’s production as well as business’s customer service.
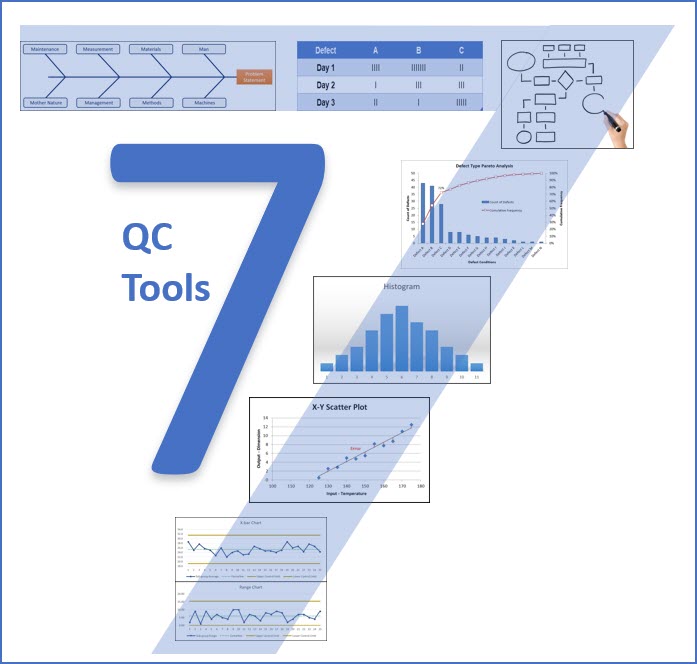
In addition to the 7 existing quality management tools, 7 new quality management tools are considered a methodology to help learners acquire knowledge of how to manage and control activities to make appropriate decisions, simultaneously, continuously improve the organization’s management system
The course “7 new quality management tools” will help trainees learn all about this new set of management tools and their benefits when applying to solving real problems in the business.
COURSE OVERVIEW
Name of the course: New 7 Quality Control tools
Object: Line leader, supervisor, team leader, sub leader
Training time: 2 – 3 days (designed as customer’s requirements)
Language: Vietnamese
Lecturers: Vietnamese
Forms of training: Inhouse or Public workshop
Training methods: Lecture presentation, discussion, and practice are organized in the classroom
PURPOSE OF COURSE
- Understand the purpose and meaning of 7 new QC tools to find a logical solution to solve problems
- Improve group activities to come up with many ideas to solve problems scientifically, logically and methodically
TRAINING CONTENT IN THE COURSE
Topic 1: Overview of 7 new QC tools
- What are 7 new QC tools?
- When will the 7 new QC tools be used?
- Why should 7 QC tools be learnt?
- How to use 7 new QC tools?
- Practice: Identify the status of using 7 new QC tools at the company
Topic 2: Relationship diagram
- What is the relationship diagram?
- The purpose of the relationship diagram
- Steps to make the relationship diagram
- Identify the problem
- Make a list of reasons
- Connect causes and effects with arrows
- Downsize causes and effects
- Keep track of causes and effects
- Practice: Identify the causes of the problem by using the relationship diagram
Topic 3: Tree diagram
- What is a tree diagram?
- Purpose of the tree diagram
- Steps to make the tree diagram
- Set out basic objectives
- Practice the first step
- Practice the second and third steps
- Complete the diagram by confirming the relationship of objectives and measures
- Evaluate measures and decide items to practice
- Practice: Use the tree diagram to analyze work into detailed tasks
Topic 4: Matrix diagrams
- What is a matrix diagram?
- The purpose of the matrix diagram
- Steps to make the matrix diagram
- Mark the circle evaluation, triangle, and X on intersections and handle on the horizontal lines and improved items on the vertical line when the diagram is on two-dimensional arrays
- Use sentences and short phrases for items as much as possible
- Practice: Use the matrix diagram to choose better topics or countermeasures
Topic 5: Homogeneous diagram
- What is a homogeneous diagram?
- The purpose of the homogeneous diagram
- Steps to make homogeneous diagram
- Identify topics
- Collect language data and write to the tag
- Collect homogeneous tag
- Create relationship tag
- Sort homogeneous tag into groups and summarize
- Practice: Use homogeneous diagram to group homogeneous problems
Topic 6: Arrow diagram
- What is an arrow diagram?
- The purpose of the Arrow diagram
- Steps to make the arow diagram
- Outline all the necessary processes to create a daily plan
- Create items to follow the above procedure
- Decide operating procedure
- Research the number of operating days and record them in the operating category
- Create the arrow diagram
- Practice: Use the arrow diagram to understand the workflow and identify points to shorten time
Topic 7: Process decision program chart (PDPC)
- What is PDPC?
- The purpose of the PDPC
- Steps to make the PDPC
- Identify the topic
- Determine the starting time
- Clearly set preset items
- Restructure PDPC
- Review PDPC and decide the best route
- Practice: Use PDPC to develop a work flow chart
Topic 8: Matrix data analysis
- What is matrix data analysis?
- Purpose of matrix data analysis
- Steps to perform matrix data analysis
- Summarize different data for the matrix
- Summarize each component having a correlation with each data by main component analysis method
- Learn collective strength and key characteristics
- Practice: Use Matrix Data Analysis for a better solution
Course review, action plan and certification
FEEDBACK
“7 QC tools can be applied across all industries”
“The difference between the product quality of Japanese compared to other countries is that they strictly adhere to the principles and methods of working quality and product quality management”
“Learn and apply 7 new QC tools with the most serious attitude to bring high efficiency to the production and business activities of enterprises”


